Dashboard Guide
The backfeedr dashboard provides a web-based interface for monitoring your app’s crashes and metrics.
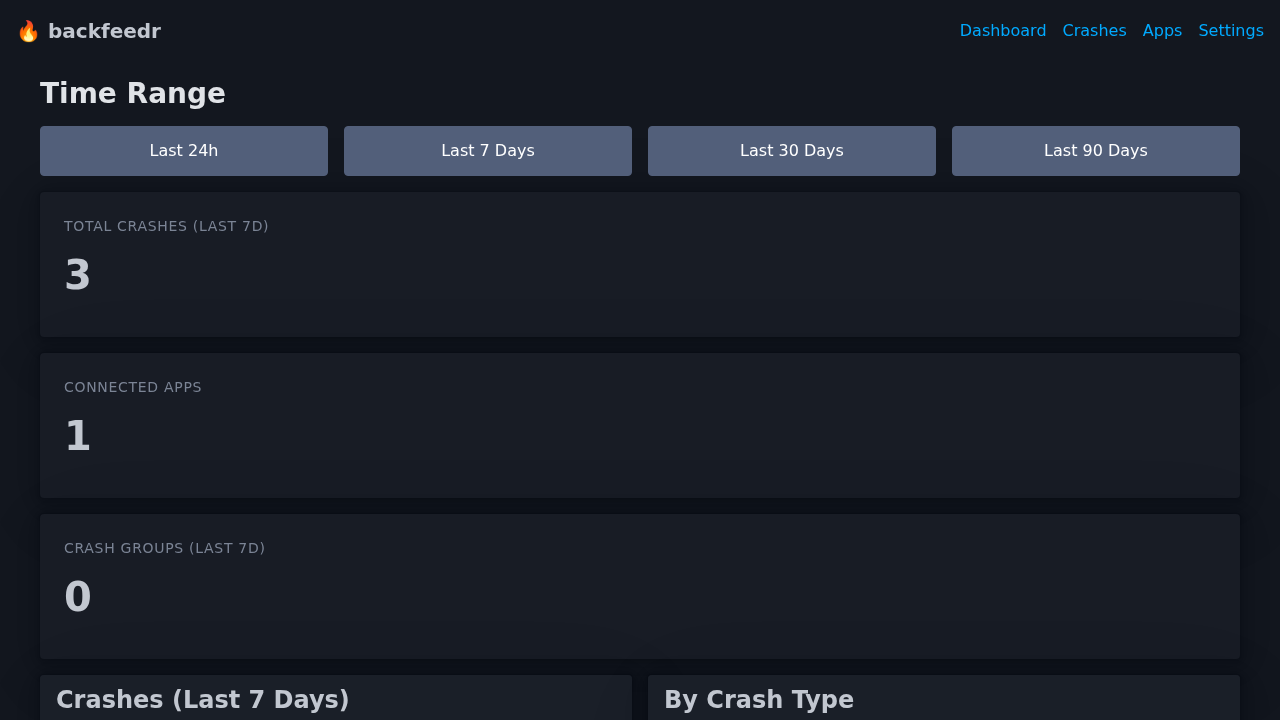 Dashboard showing crash statistics, charts, and recent crashes
Accessing the Dashboard
Once your server is running, open your browser:
http://your-server:8080
Dashboard Overview
Stats Cards
At the top of the dashboard, you’ll see three key metrics:
| Metric | Description |
|---|---|
| Total Crashes (Last 7d) | Number of crashes in the selected time period |
| Connected Apps | Number of apps registered with API keys |
| Crash Groups (Last 7d) | Unique crash types (grouped by exception) |
Time Range Filter
Use the time range buttons to filter data:
- Last 24h - Crashes from the last 24 hours
- Last 7 Days - Crashes from the last week (default)
- Last 30 Days - Crashes from the last month
- Last 90 Days - Crashes from the last quarter
The dashboard automatically updates when you select a different time range.
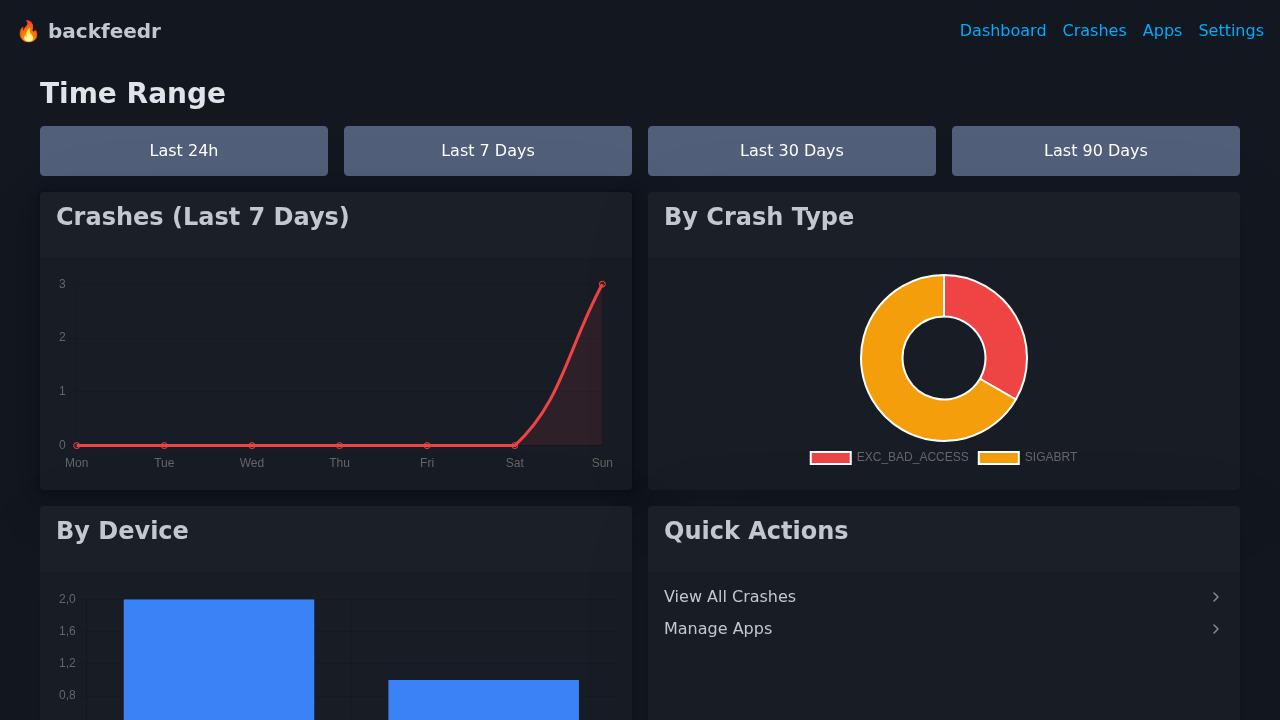
Charts
Daily Crashes (Line Chart)
Shows crash frequency over the last 7 days:
- X-axis: Days of the week
- Y-axis: Number of crashes
- Trend: Spot patterns (e.g., more crashes on weekends)
Crash Types (Doughnut Chart)
Shows distribution of exception types:
- EXC_BAD_ACCESS - Memory access errors
- SIGABRT - Abnormal termination
- Other types - Custom exception types
By Device (Bar Chart)
Shows which device models are most affected:
- Helps identify device-specific issues
- Shows top 10 devices
- Updated from last 90 days of data
Crash List
 List of all crashes with grouping by exception type
Recent Crashes Table
Lists individual crash reports with:
- Type: Exception type (e.g.,
EXC_BAD_ACCESS) - Reason: Human-readable description
- App Version: Which app version crashed
- Time: When the crash occurred
Crash Groups Table
Shows aggregated crash data:
- Groups crashes by exception type
- Shows total count per group
- Helps identify most common crashes
Crash Detail View
 Detailed view of a single crash with stack trace and device information
Click “View” on any crash to see detailed information:
Stack Trace
Full symbolicated stack trace showing:
0: ContentView.body.getter
   ContentView.swift:42
1: SwiftUI.View.update
Device Information
| Field | Description |
|---|---|
| ID | Unique crash identifier |
| Group | Hash for grouping similar crashes |
| Time | When crash occurred (UTC) |
| App Version | App version that crashed |
| Build | Build number |
| OS Version | iOS version on device |
| Device | Device model (e.g., iPhone16,1) |
| Locale | Device locale (e.g., de_DE) |
| Memory | Free RAM at crash time |
| Battery | Battery level and charging state |
Breadcrumbs
(Coming soon) - Context about what user was doing before crash.
Apps Management
Viewing Apps
Navigate to /apps to see all registered apps:
- App name
- Bundle ID
- API key (shown once on creation)
- Creation date
Creating New App
- Click “+ New App”
- Enter app name (e.g., “MyApp”)
- Enter bundle ID (e.g., “com.example.myapp”)
- Copy the generated API key
- Use key in your iOS app
⚠️ Important: The API key is shown only once. Save it securely!
Rotating API Key
If a key is compromised:
- Go to app details
- Click “Rotate Key”
- Update your iOS app with new key
- Old key becomes invalid immediately
Settings
Data Retention
Configure how long to keep data:
- Default: 90 days
- Set via
BACKFEEDR_RETENTION_DAYSenvironment variable - Older data is automatically deleted
Auth Token
The dashboard uses a separate auth token:
- Set via
BACKFEEDR_AUTH_TOKEN - Auto-generated if not set
- Keep this secret!
Tips
Auto-Refresh
The dashboard refreshes every 60 seconds automatically. You can also refresh manually.
Exporting Data
(Coming soon) - Export crash data as CSV or JSON.
Keyboard Shortcuts
R- Refresh dashboardC- Go to crash listA- Go to apps
Troubleshooting
No crashes showing
- Check that your iOS app is sending crashes
- Verify API key is correct
- Check server logs:
./backfeedrordocker logs
Charts not loading
- Check browser console for JavaScript errors
- Ensure Chart.js is loading (check network tab)
- Try hard refresh:
Ctrl+Shift+R
Dashboard slow
- Reduce time range (e.g., 24h instead of 90d)
- Check database size:
ls -lh data/ - Consider data retention settings
Customization
Dark Mode
The dashboard automatically uses your system’s dark/light mode preference.
Custom CSS
(Advanced) You can customize styles by editing web/static/custom.css.